Most people judge Wi-Fi by one number. They look at signal strength and assume a strong signal means good performance. However, that assumption misses half the picture. In practice, the signal to noise ratio decides whether your network feels fast or frustrating. Therefore, understanding it matters more than chasing bars on a screen.
What signal strength actually measures
RSSI, short for received signal strength indicator, measures how loud the access point sounds to your device. Generally, specialists express it in negative dBm values. For example, -50 dBm is strong and -75 dBm is weak. Notably, a strong RSSI looks reassuring on a survey map. However, loudness alone tells you nothing about clarity. Meanwhile, the airwaves around that signal are rarely silent. In fact, every environment carries background noise.
Where the noise comes from
Noise is any radio energy that is not your Wi-Fi signal. Microwave ovens, Bluetooth devices, and neighbouring networks all add to it. Additionally, older cordless phones and poorly shielded equipment leak energy into the band. In a busy office, the noise floor climbs quickly. Consequently, your device must work harder to separate the signal from the clutter. For this reason, two sites with identical signal strength can perform very differently.
Signal to noise ratio, explained
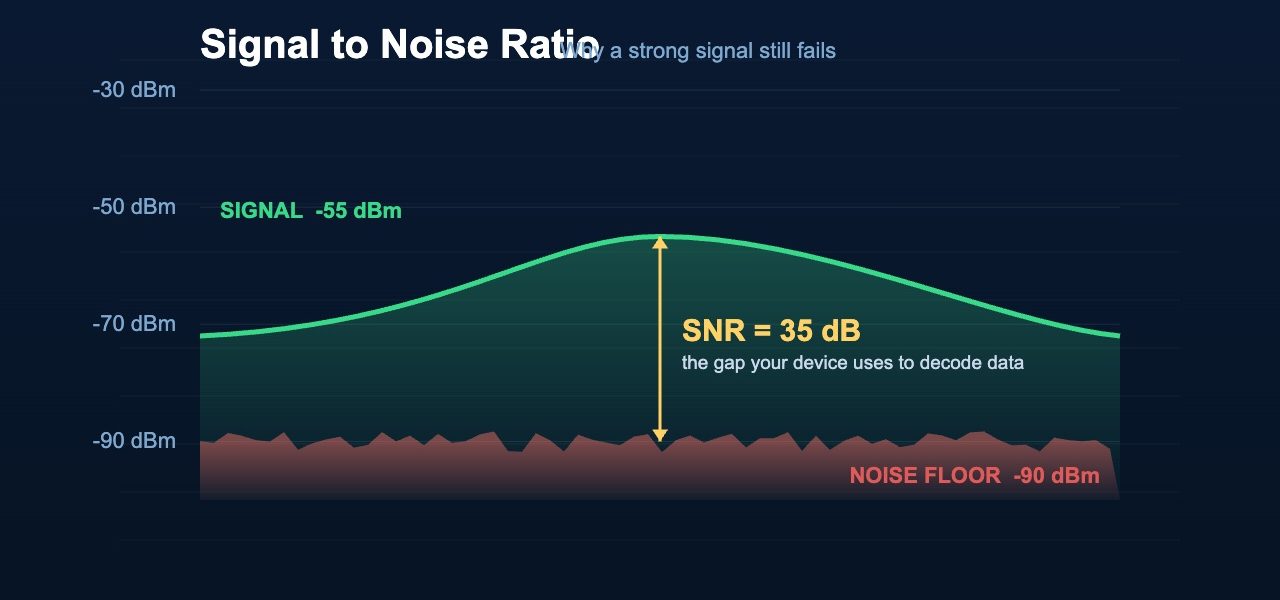
The signal to noise ratio is the gap between your signal and the noise floor. Specifically, we measure it in decibels. For instance, a -50 dBm signal sitting above a -90 dBm noise floor gives you 40 dB of SNR. That gap is what your device actually uses to decode data. Importantly, a wider gap means faster and more reliable throughput. Conversely, a narrow gap forces the network to slow down. As a result, video calls stutter and file transfers crawl even when the signal looks strong.
What good numbers look like in practice
For basic connectivity, aim for at least 20 dB of SNR. For voice and video, target 25 dB or higher. In testing, I have watched networks with a -55 dBm signal fail because the noise floor sat at -70 dBm. Meanwhile, a cleaner site at -65 dBm performed better with a quiet -90 dBm floor. Therefore, the raw signal number lied. Ultimately, the ratio told the truth.
Why this matters for buying decisions
Vendors love to sell coverage. However, coverage maps rarely show the noise floor. As a result, a proposal can promise strong signal everywhere and still deliver a poor experience. For this reason, ask any vendor how they plan to measure and manage noise, not just signal. In practice, that single question separates the practitioners from the box movers.
The bottom line
When we run an RF site survey, we measure both signal and noise across the whole space. That way, we find the interference that basic tools miss. Whether you need a fresh Wi-Fi design, a survey, or troubleshooting on a network that should work but does not, the numbers guide the fix. Have questions about how these developments affect your network? Reach out to the Baiden Group team.