I get called into networks all the time where users swear their Wi-Fi is “full bars” but their video calls still freeze. The bars are lying to them. Full signal strength does not mean full signal quality, and that gap causes more support tickets than almost any other Wi-Fi myth I know. Specifically, most IT teams look at one number when they should be looking at three. In this post I want to walk through what your signal meter actually measures. I will also cover why it matters less than you think, and what you should check instead.
What RSSI Actually Measures
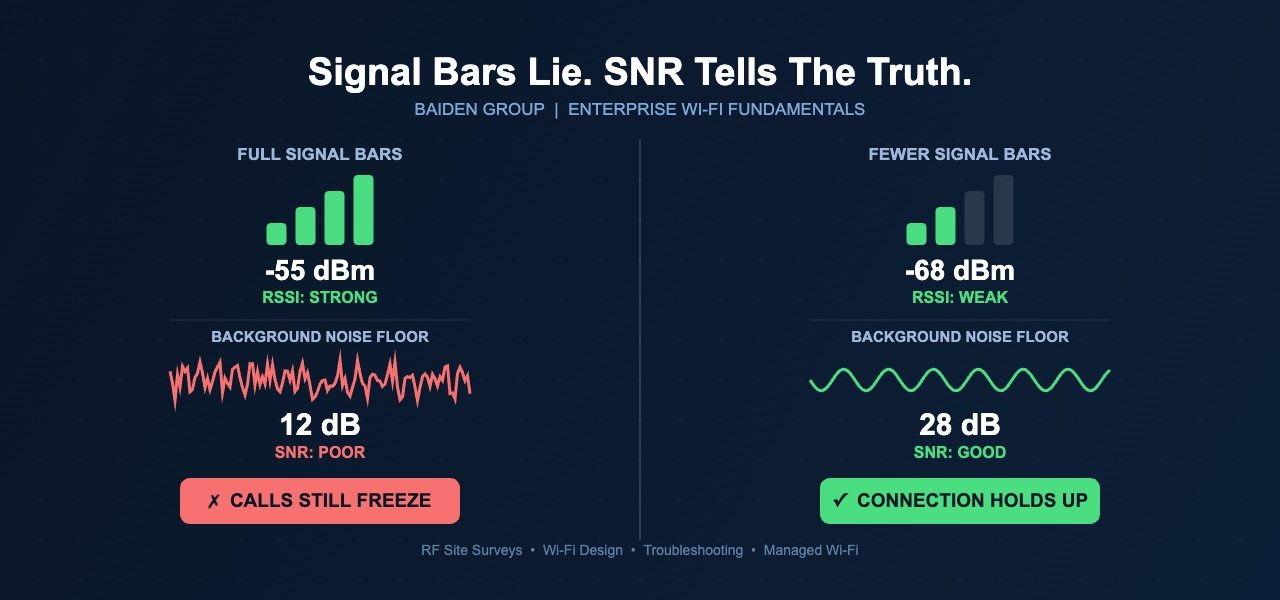
RSSI stands for Received Signal Strength Indicator. It tells you how loud the Wi-Fi signal is when it reaches a device, measured in decibels relative to a milliwatt. Generally, anything stronger than negative 65 dBm counts as a strong signal on a laptop. However, RSSI says nothing about noise, interference, or how many other devices are fighting for the same airtime. For this reason, a client can show five bars and still get terrible throughput. I have seen it happen in hospitals, warehouses, and government buildings more times than I can count. Notably, the strongest signal in a room is sometimes the worst place to connect. That is because it often sits closest to a noisy AP or a source of interference.
Why SNR Tells the Real Story
SNR stands for Signal to Noise Ratio, and it is the number that actually predicts performance. It compares your signal strength against the background noise floor. Consequently, a weak signal in a quiet environment can outperform a strong signal in a noisy one. In practice, I want to see an SNR of at least 25 dB for reliable data and 30 dB or higher for voice and video. Meanwhile, most consumer devices and even some enterprise dashboards only report RSSI, which leaves IT teams flying blind. As a result, networks get tuned for signal strength instead of signal quality, and the real problem never gets fixed.
Co-Channel Interference Hides in Plain Sight
Co-channel interference happens when two or more access points use the same channel and their coverage areas overlap. Every device on that channel has to take turns talking, even if they belong to different networks entirely. Additionally, this problem gets worse in dense environments like open offices, schools, and casinos where teams add APs over time without a real channel plan. In fact, I once walked into a hospital lobby and counted seven visible access points before I had spoken to a single person on staff. That is not coverage. That is congestion, and it gets worse with every AP added without a plan.
Roaming and Band Steering Compound the Problem
Roaming is how a device decides when to switch from one AP to another as a user moves through a building. Band steering is how a network nudges dual band devices toward the less crowded 5 GHz or 6 GHz spectrum instead of 2.4 GHz. Both settings depend on RSSI thresholds by default, which brings us back to the same flawed measurement. Therefore, a device can hang onto a weak, noisy AP because its signal strength still looks acceptable. A stronger, quieter AP might be available nearby, but the device never checks. Similarly, aggressive band steering without proper tuning can push devices onto a technically less congested band. That band can still deliver a poor SNR at that specific location. In short, roaming and band steering are only as good as the data driving them.
None of this shows up on a basic signal bar, and that is exactly why so many “good coverage” networks still perform poorly. At Baiden Group we run RF site surveys that measure SNR, co-channel interference, and roaming behavior, not just signal strength. We design channel plans and AP placement around real airtime conditions, and we troubleshoot the networks that relied on signal bars alone. Have questions about how these developments affect your network? Reach out to the Baiden Group team.