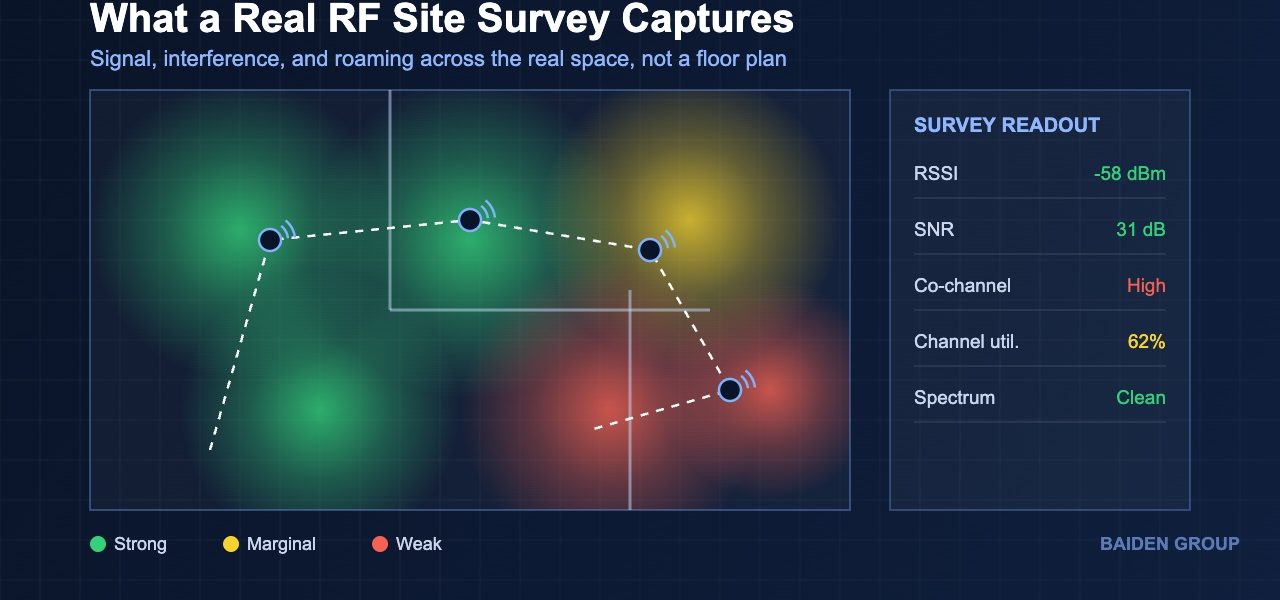
Most enterprise Wi-Fi problems trace back to one thing. The network was designed on paper and never validated in the building. An RF site survey closes that gap. However, not every survey deserves the name. Some are thorough. Others are a laptop walk and a pretty heatmap. This post explains what a real survey involves, and it flags the warning signs of a weak one.
What a real RF site survey actually measures
Radio frequency behaves differently in every building. Therefore, a proper survey measures the actual RF environment rather than assuming it. Specifically, a specialist walks the floor with calibrated gear and records signal strength, signal to noise ratio, channel usage, and co-channel interference at real client height. Additionally, the survey captures non-Wi-Fi interference that a normal scan cannot see. For instance, microwave ovens, cordless devices, and rogue transmitters all show up on a spectrum analyzer but stay invisible to a laptop.
Furthermore, a good survey accounts for how the space is used. A warehouse full of metal racking attenuates signal in ways an empty shell never will. Similarly, shielded rooms and dense construction block RF that a floor plan would never reveal. In practice, the building materials decide the design. Consequently, the survey has to happen in the real space, under real conditions, not from a desk.
Why the survey matters more than the hardware
Vendors sell access points on specifications. Buyers assume more radios mean better coverage. However, coverage and capacity are not the same thing. A survey proves what the RF actually does once the walls, glass, and racking get involved. For example, I have walked into sites where a stack of access points were all visible from one spot on the floor. That is not strong coverage. Instead, it is over-provisioning, and it creates co-channel interference that degrades the whole cell.
Moreover, a survey tells you where devices will roam and where they will stall. Roaming failures cause dropped scanner sessions, dropped calls, and lost orders. Notably, these failures rarely show up on a coverage map that only checks signal strength. Thus, the value of a survey lies in what it catches before the install, not after the complaints start.
Warning signs of a weak survey
Not all surveys are equal. First, watch for a predictive design that was never validated on site. A predictive model is only as good as its inputs. Therefore, if nobody disclosed the glass type or the wall construction, the model predicted coverage that was never physically possible. I have seen coated glass and dense partitions kill an outdoor coverage plan because that detail was never shared with the design team.
Second, be skeptical of a survey with no spectrum data. If the report shows signal strength but never mentions interference, the specialist measured half the problem. Third, question a survey done in an empty building when the space will be full of people and inventory later. Bodies and stock absorb RF. Consequently, an empty-room survey overstates real world performance.
Finally, a heatmap alone is not a survey. Anyone can generate a green map. In contrast, a real deliverable explains the channel plan, the interference sources, the roaming thresholds, and the specific fixes. Ultimately, the map is the summary, not the substance.
When to re-survey
RF conditions change. Therefore, a survey is a snapshot, not a permanent record. Specifically, re-survey after any layout change, any tenant fit-out, any hardware refresh, and any complaint pattern tied to time or location. For example, new equipment near a break area can hammer nearby 2.4 GHz radios that worked fine last year. In short, the building moved, so the RF moved with it.
At Baiden Group, we run RF site surveys, Wi-Fi design, and troubleshooting for enterprise environments across Canada. We measure the real space, we explain the findings, and we tell you what to do about them. Have questions about how these developments affect your network? Reach out to the Baiden Group team.